At the start of each year (or mid-year if you're just starting), set up your budget. This creates a benchmark to measure against throughout the year.
Initialization Options
- Start Fresh — Begin with empty budget fields
- Initialize from Last Year's Actuals — Pre-fill with what you actually spent last year. Good starting point if you expect similar spending.
- Initialize from Last Year's Budget — Copy last year's budget. Good if last year's plan was solid but actuals varied.
Whichever you choose, you can still adjust every number. It's just a starting point.
Revenue Forecast
For each month, enter Weeks Rented (how many weeks you expect to rent — whole weeks only) and Avg Weekly Rate (your expected average rate for that month). The "Load Rates from Pricing" button pulls rates from your Pricing Calendar if you've entered them there.
Expense Budgets
Categories are grouped by tax deduction category (Cleaning & Maintenance, Utilities, etc.). Set an annual budget for each category you expect to spend on. Categories you've excluded from budgets in Settings won't appear here.
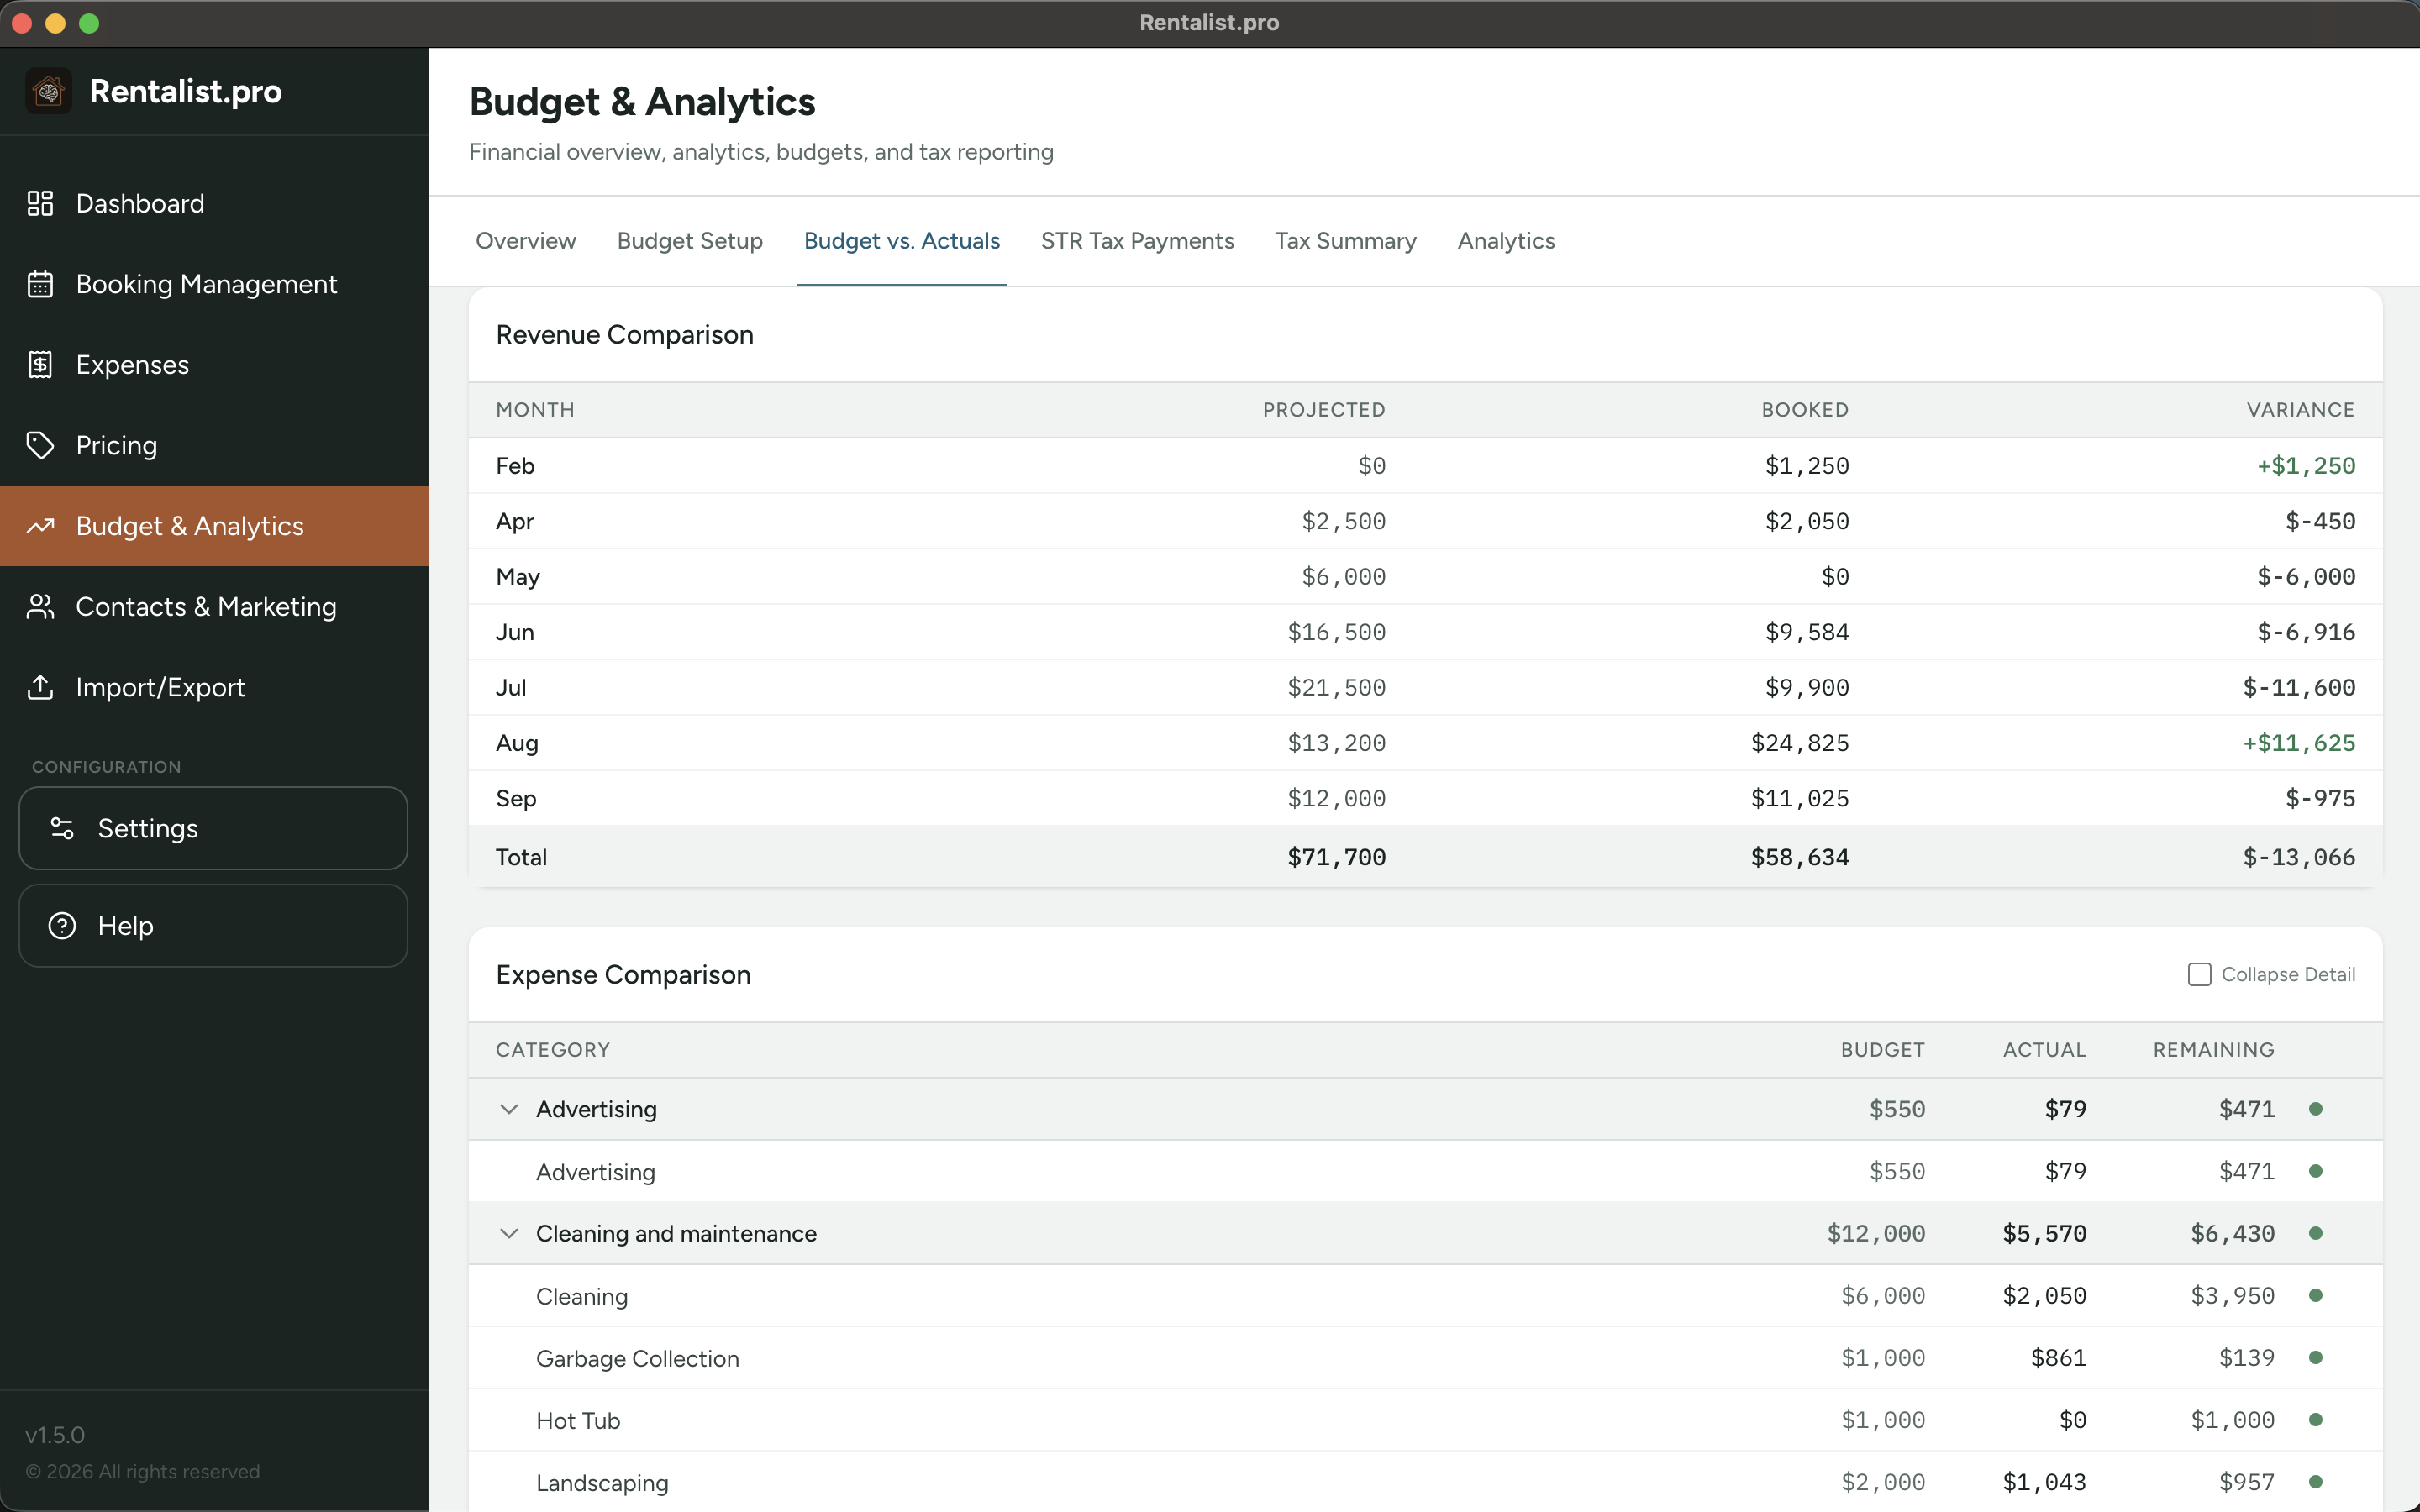
This is your real-time financial dashboard. Check it monthly to stay on track.
Revenue Section
- Budgeted — Your forecast from Budget Setup
- Booked — Actual revenue from confirmed bookings (rent + fees, not tax)
- Variance — The difference (green if ahead, red if behind)
Note: Revenue uses "booked" not "received" — it counts bookings by departure date, which aligns with when the rental income is earned.
Expense Section
- Budgeted — Your annual budget for each category
- Actual — What you've actually spent
- Remaining — Budget minus actual (shows $0 if over budget)
- Over Budget — Red indicator when actual exceeds budget
Status colors: Green (under 90%), Yellow (90%+), Red (over budget)
This tab only appears if you've configured occupancy tax in Settings.
What It Shows
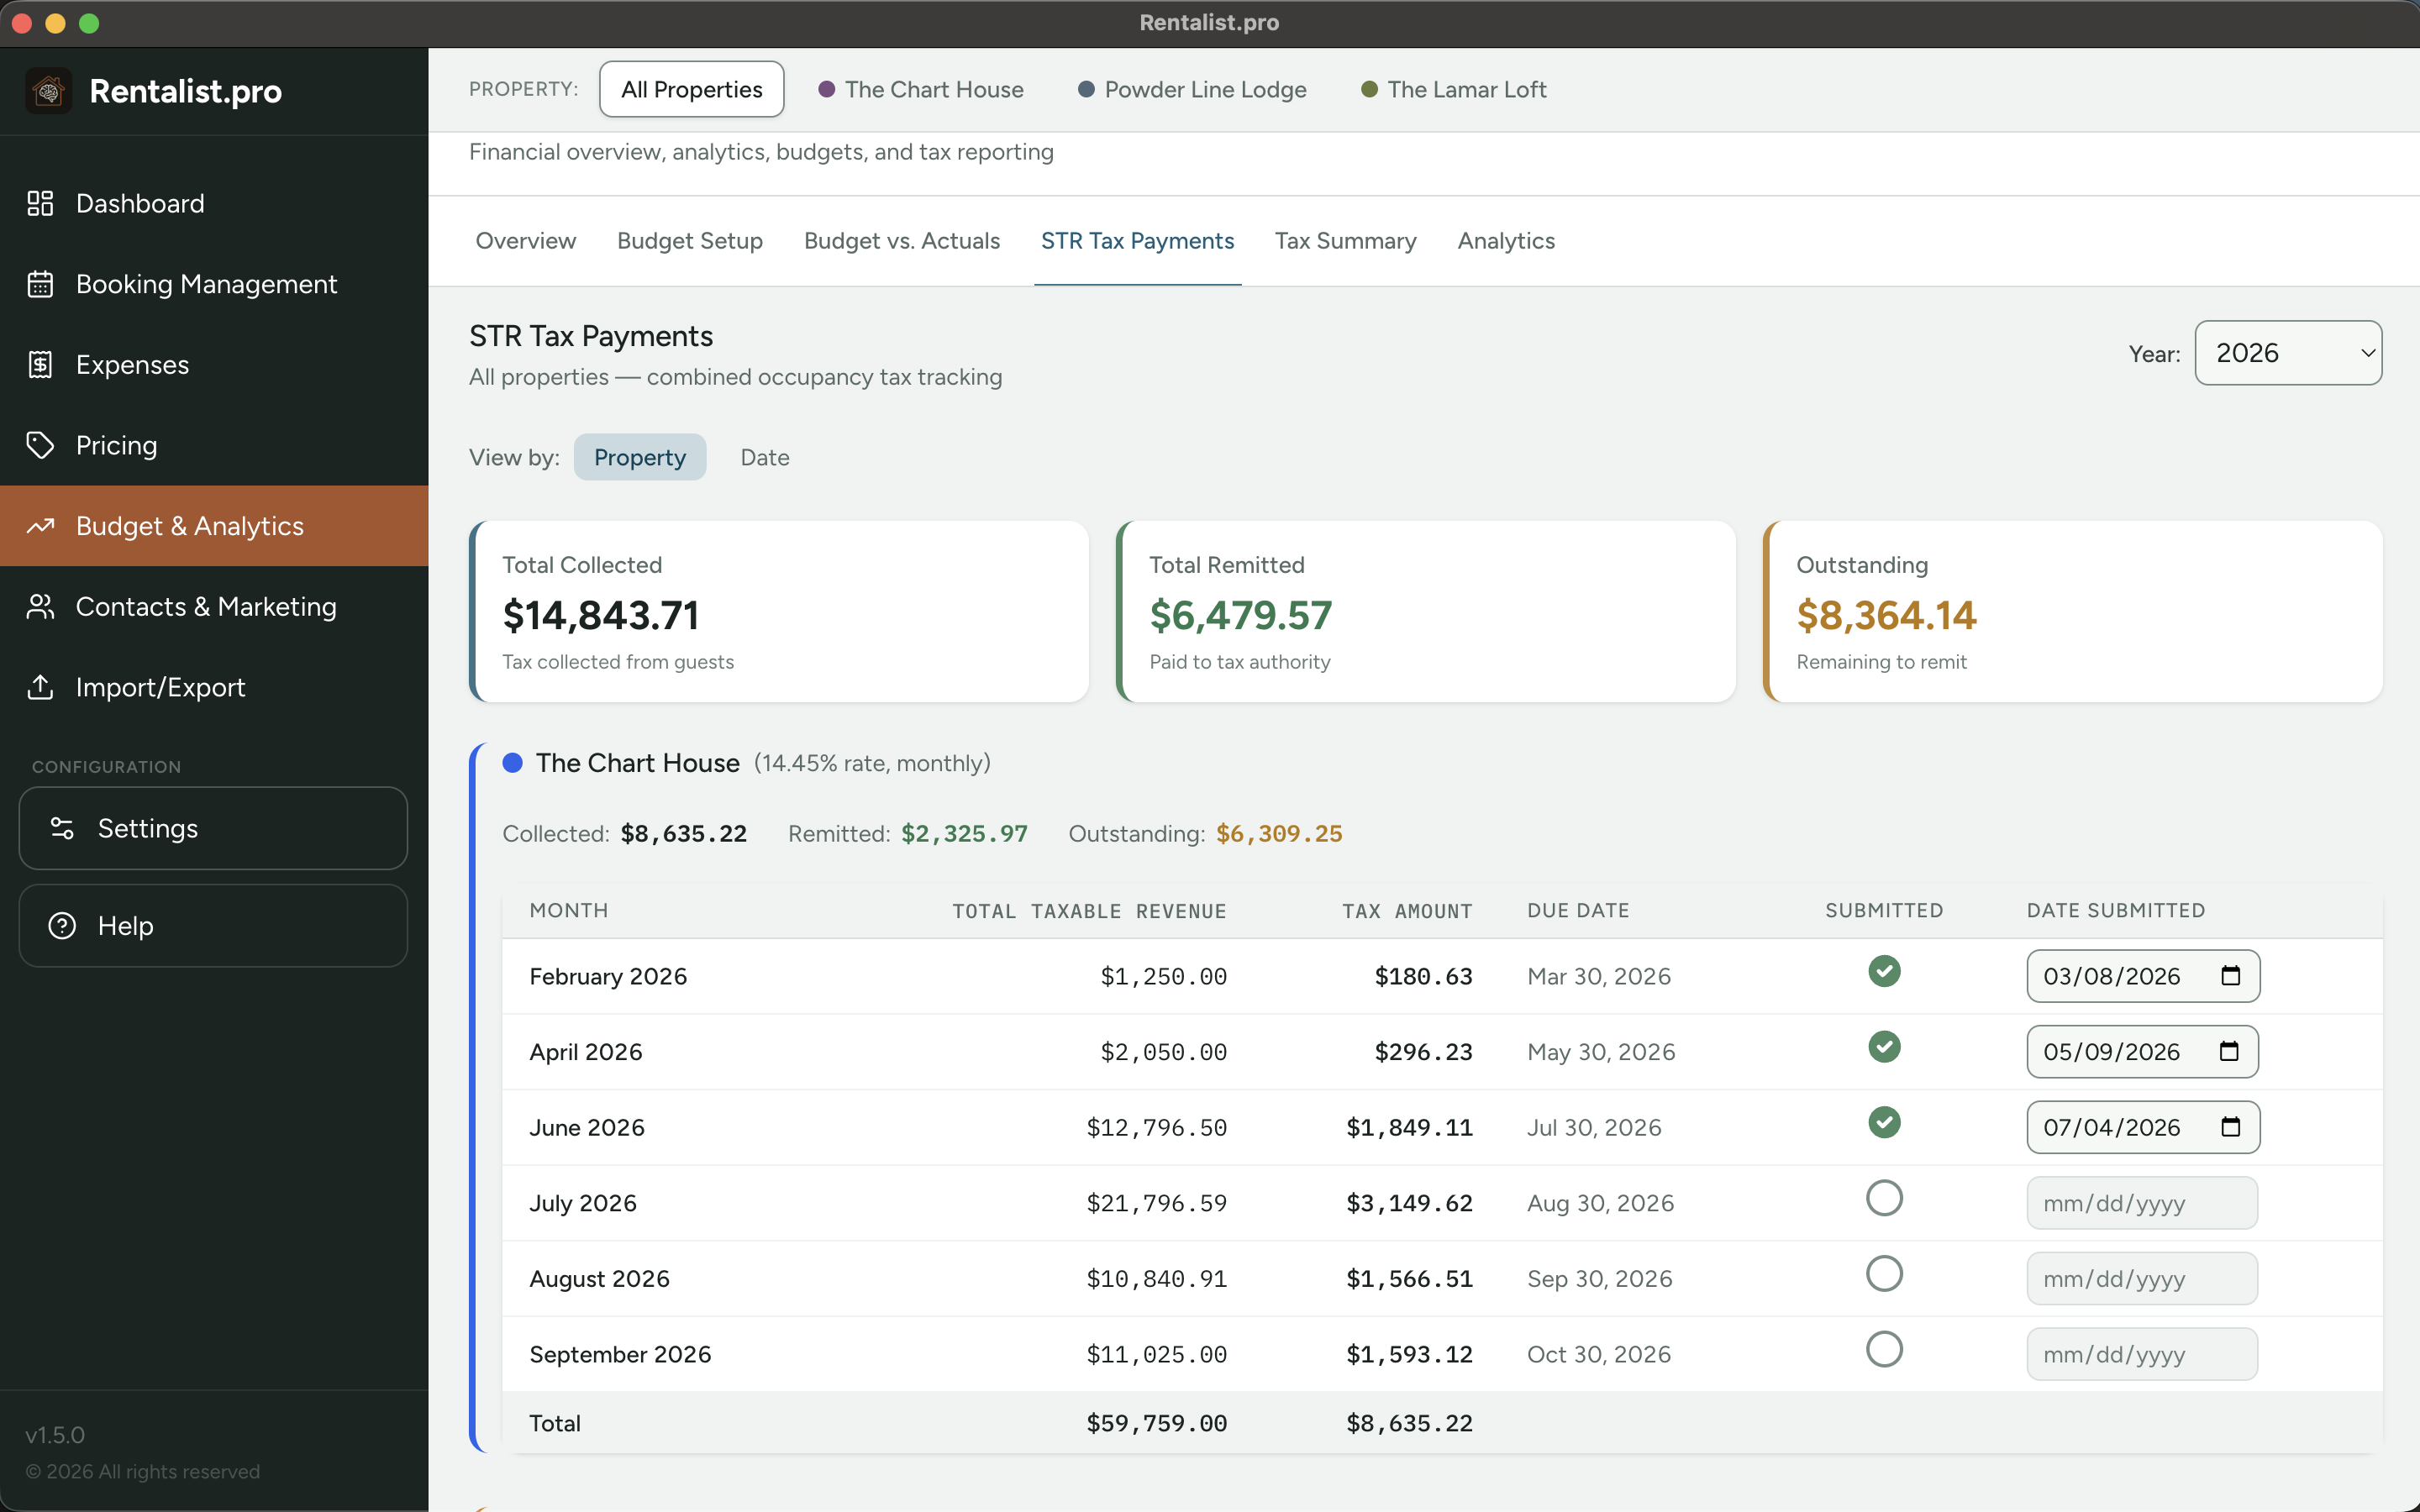
Tax periods based on your remittance frequency (monthly, quarterly, or annually). For each period: bookings that fall in that period and their tax amounts, total tax collected vs. tax remitted (paid), outstanding balance, and upcoming due dates.
Key Concepts
- Tax Calculation Basis — How bookings are assigned to periods (by arrival, departure, or spread across stay). Set this in Settings before your first payment — once you've remitted, it locks for the year.
- Platform stays — A booking on a platform that sends in all of the occupancy tax for you is left out. Where a platform sends in only part of it, your share is still tracked here.
- Marking Submitted — Tick the "Submitted" box when you send in each period's tax, and enter the date you sent it for your records. A submitted period keeps the figures you filed.
- Rate-change differences are included — If you've changed your tax rate, the extra owed on affected stays is already folded into what each period owes the state.
Past years are history, not homework
A closed year shows what you actually collected, never recalculated at today's rate. It stays accurate and readable — it just isn't dressed up in red as though you could still act on it, and a year from before you started using Rentalist is never treated as unpaid.
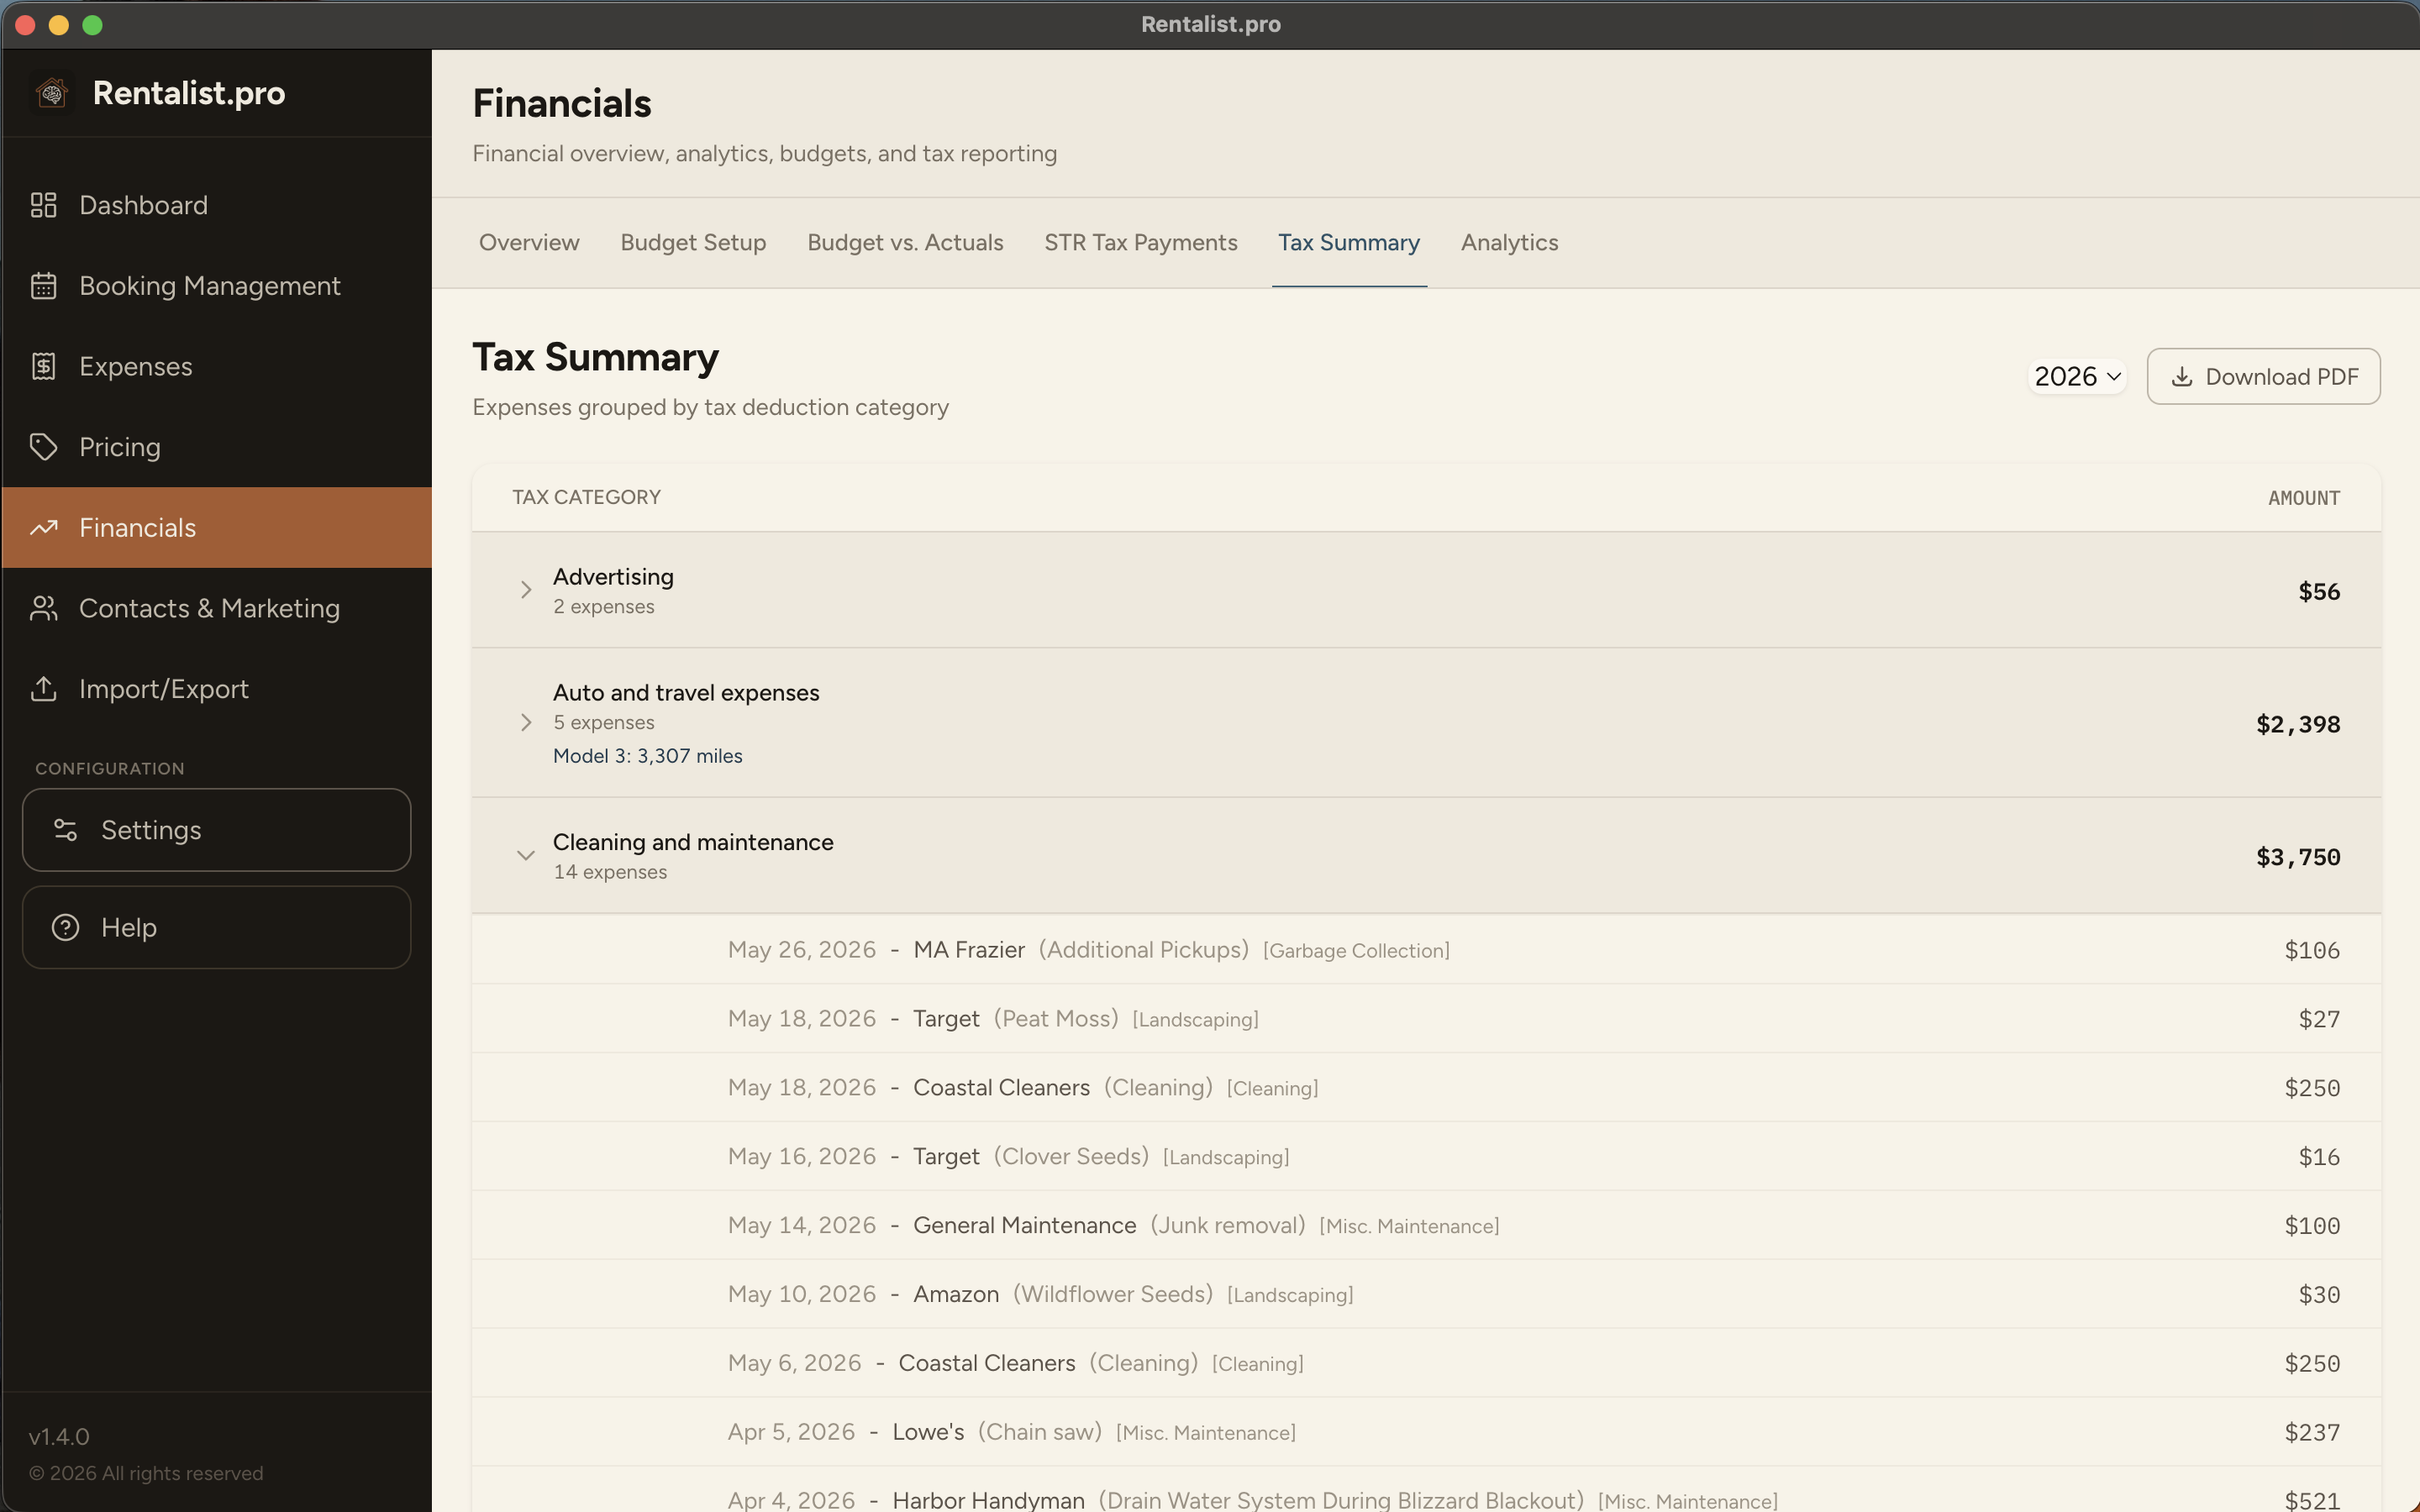
A year-end summary of your rental income and expenses organized the way your accountant needs them. Shows rental days, personal use days, revenue totals, and expenses by tax deduction category. Use this as a starting point for tax preparation — but always verify with your accountant.
Several years of your own history, asked the questions owners actually ask. Import your old spreadsheets and it's useful immediately; otherwise it gets better every season.
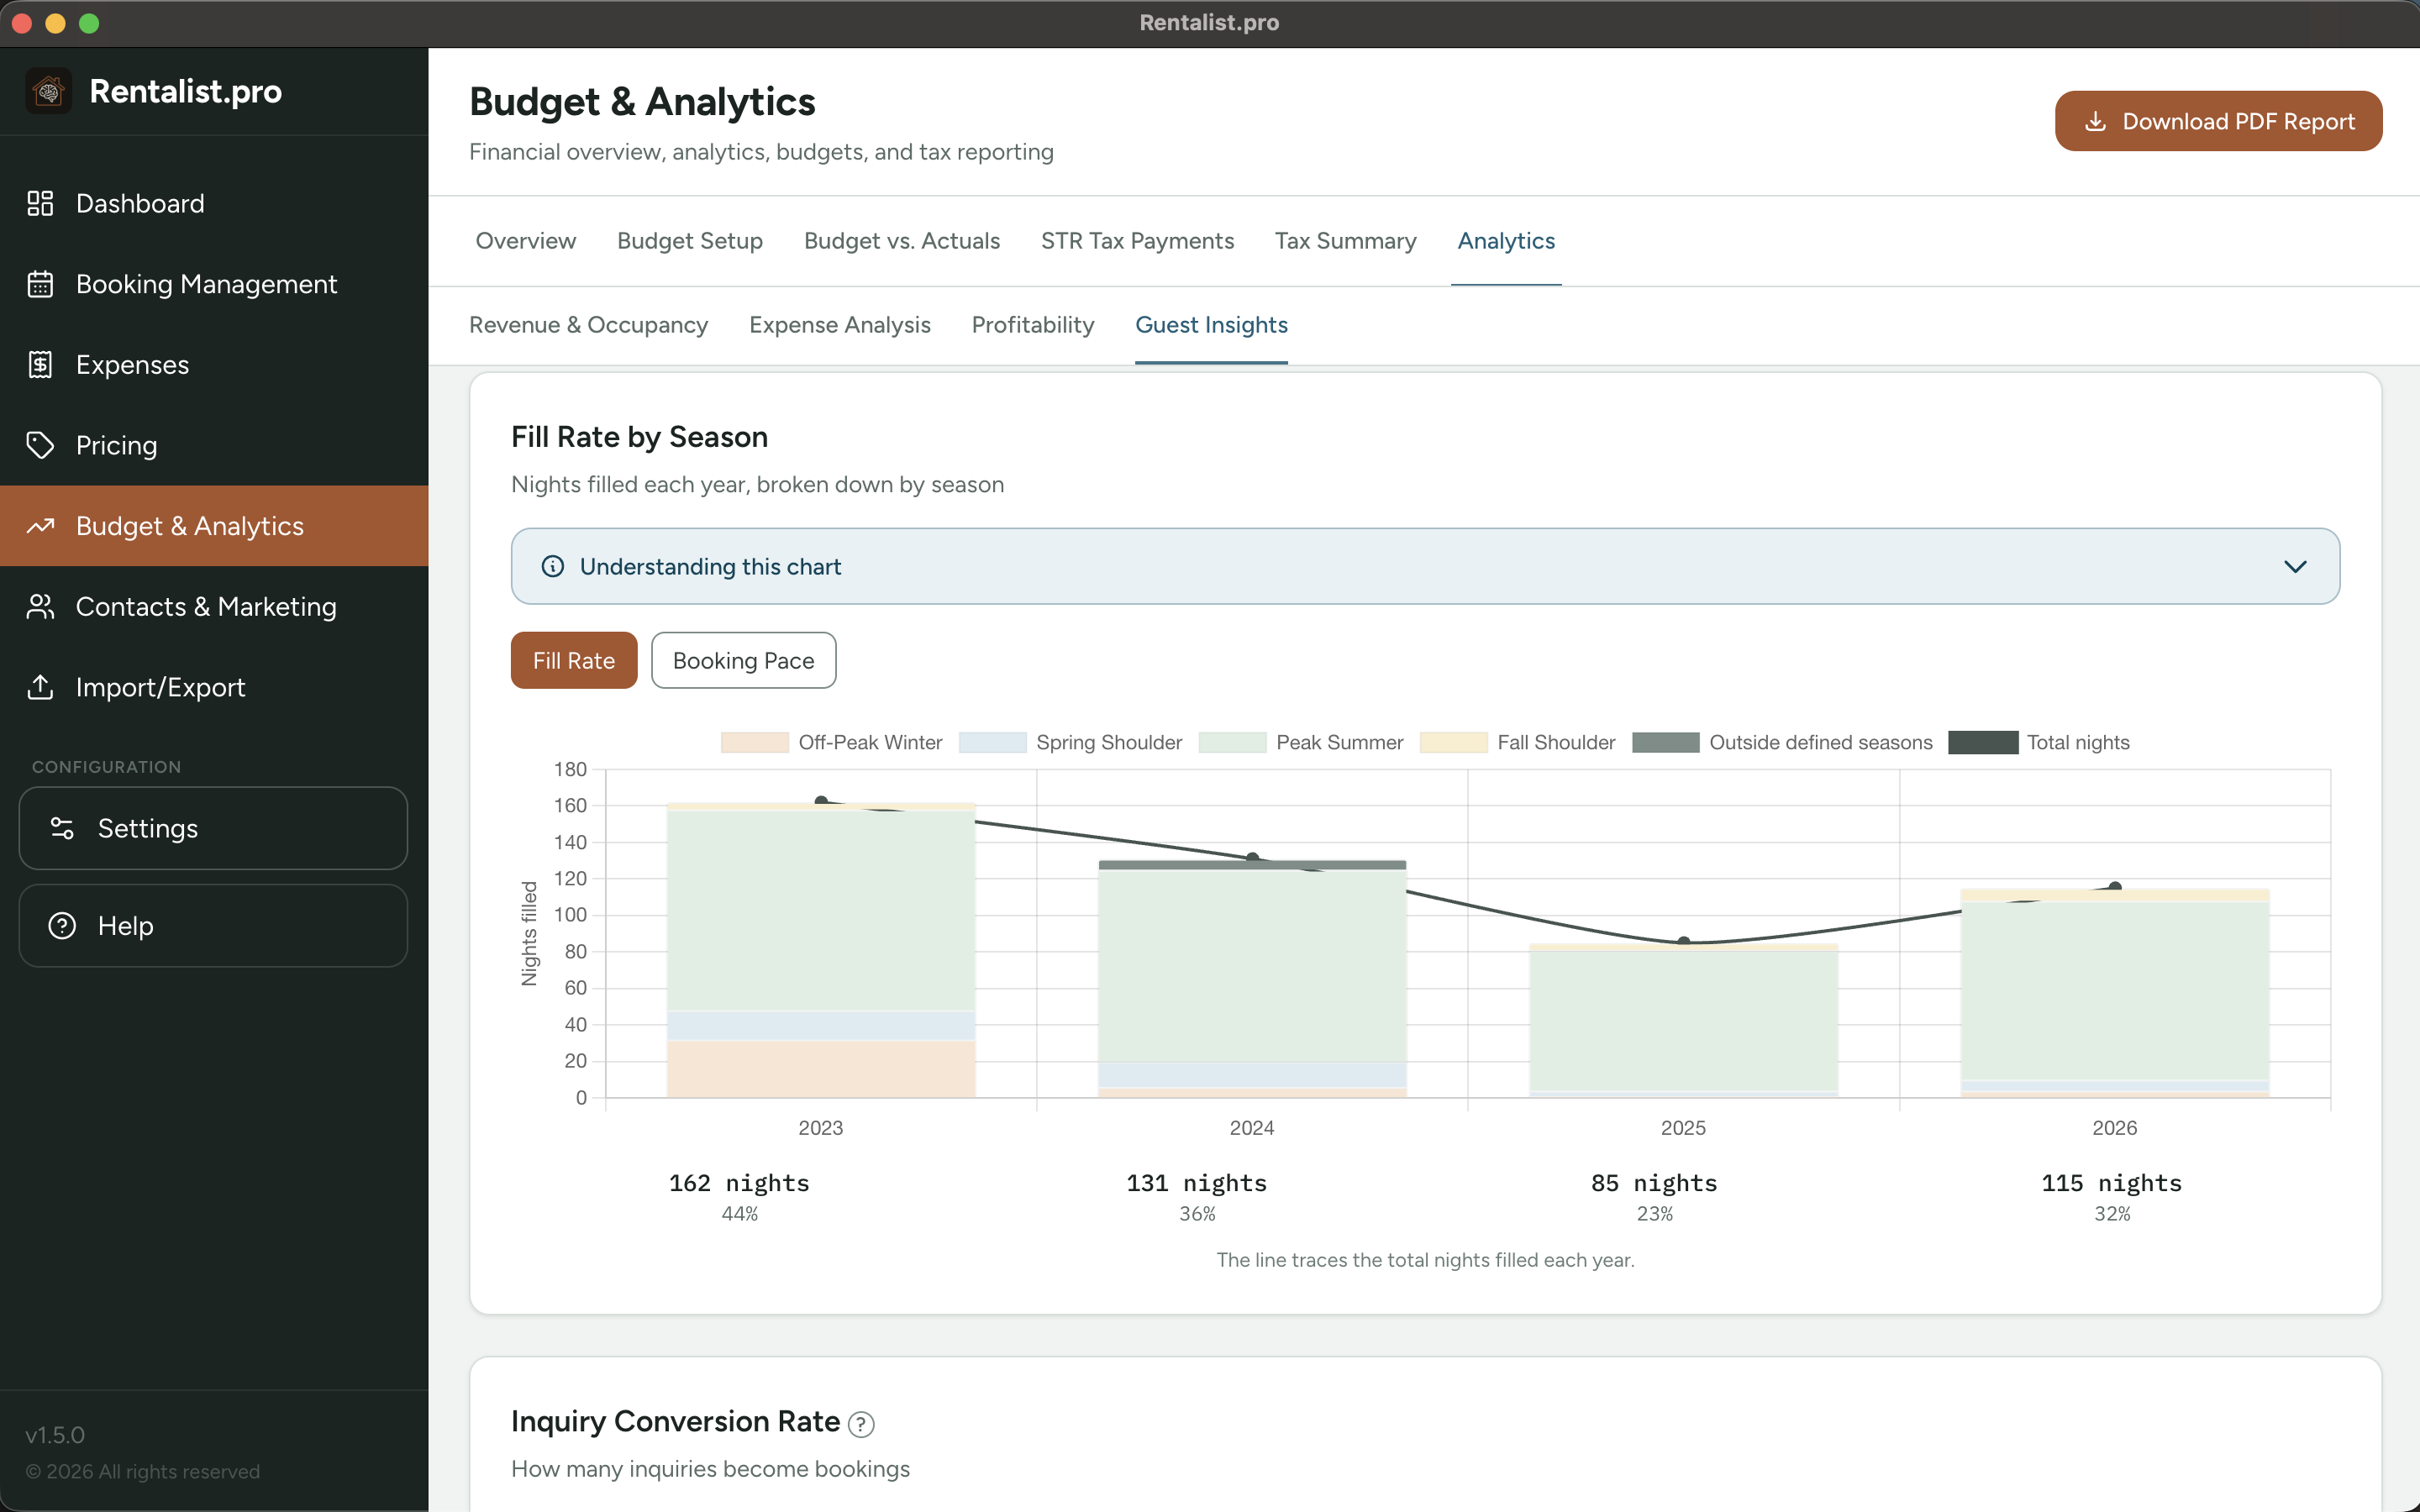
- Fill Rate by Season — how full each part of your year got, in your seasons rather than generic quarters. The clearest answer to "am I ahead of last year?"
- Booking Pace — whether this year's bookings are arriving on the same schedule as previous years, or a month behind.
- Revenue & Occupancy — revenue trends, where bookings come from, how far ahead guests book, how long they stay.
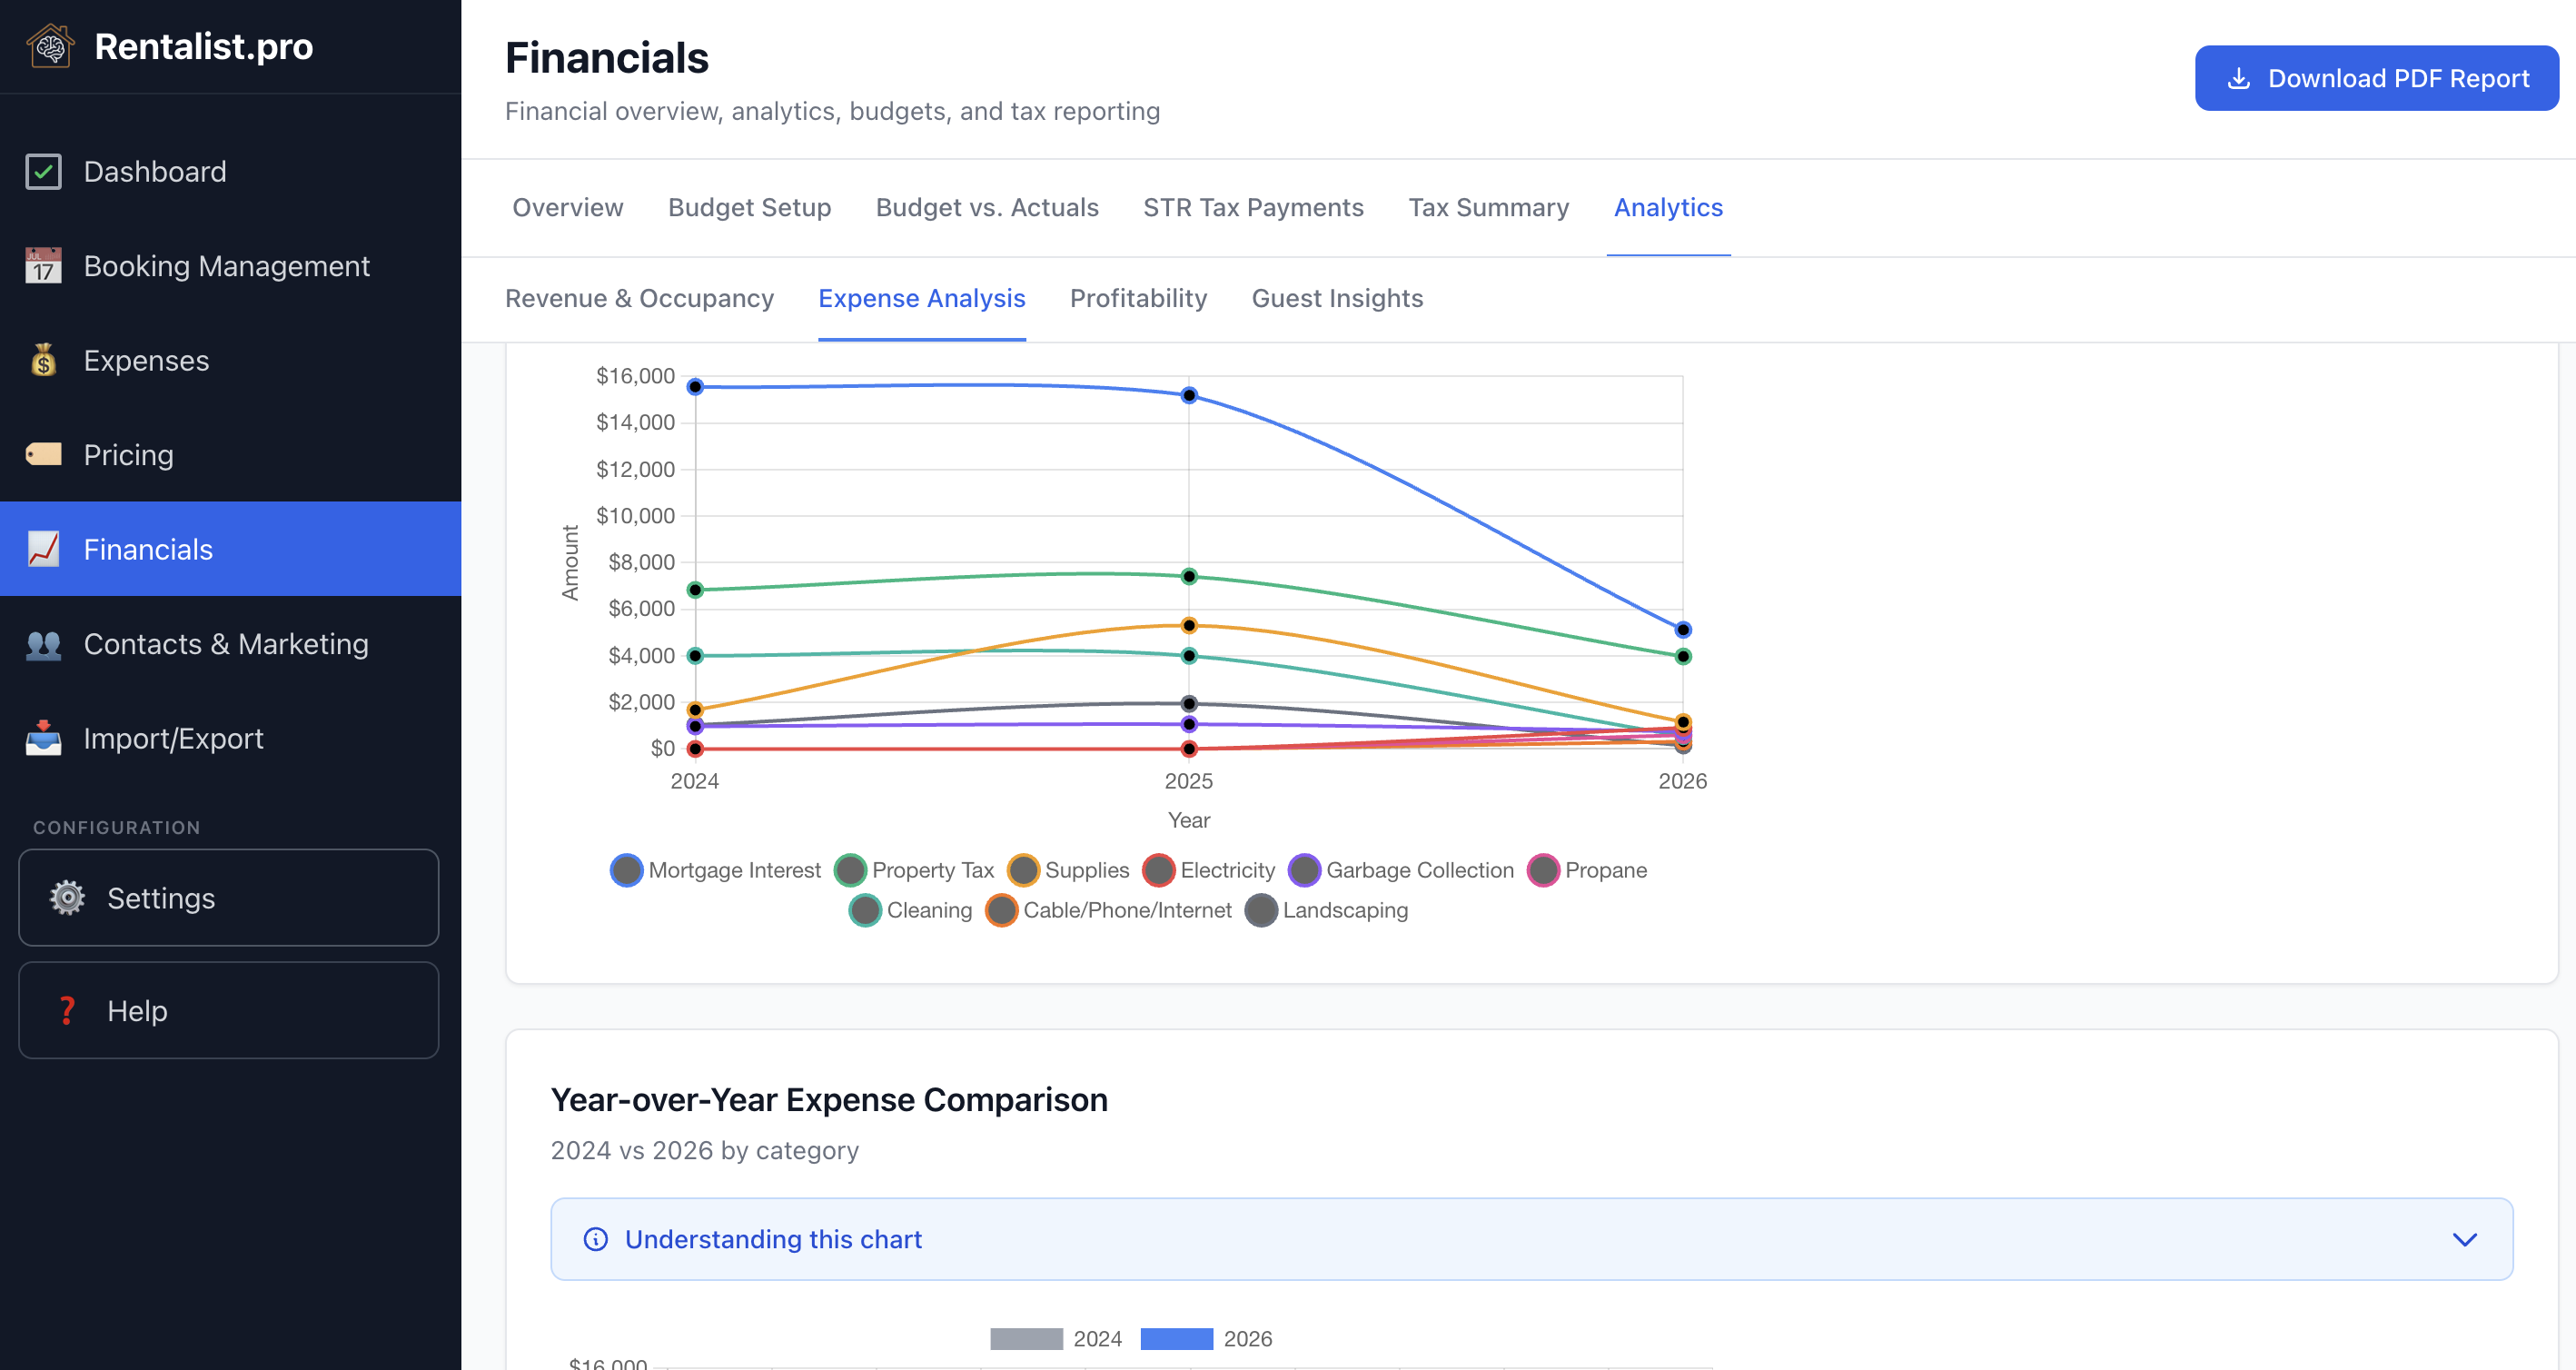
- Expense Analysis — what a night and a booking really cost you, and where the money goes.
- Profitability — net operating income over time, side by side across years.
- Guest Insights — repeat guest rate, past guests who haven't rebooked yet, inquiry conversion, and the reasons you lose bookings.
One year selector drives every chart, and it reaches back as far as your records go.
Every owner knows the feeling of looking at the calendar in May and wondering whether that empty second week of August is a problem yet. Generic advice — "drop your price 60 days out" — isn't an answer, because your weeks don't behave the same way as each other.
Rentalist answers it from your own history: it flags an open week when it's closer to arrival than that week has normally booked in past years, and stays quiet about the weeks that always go last-minute. Holidays are matched by where they fall, so "the week before Labor Day" is compared with the right week each year.
It's a prompt to look at a price, not an instruction — and you can turn it off per property.
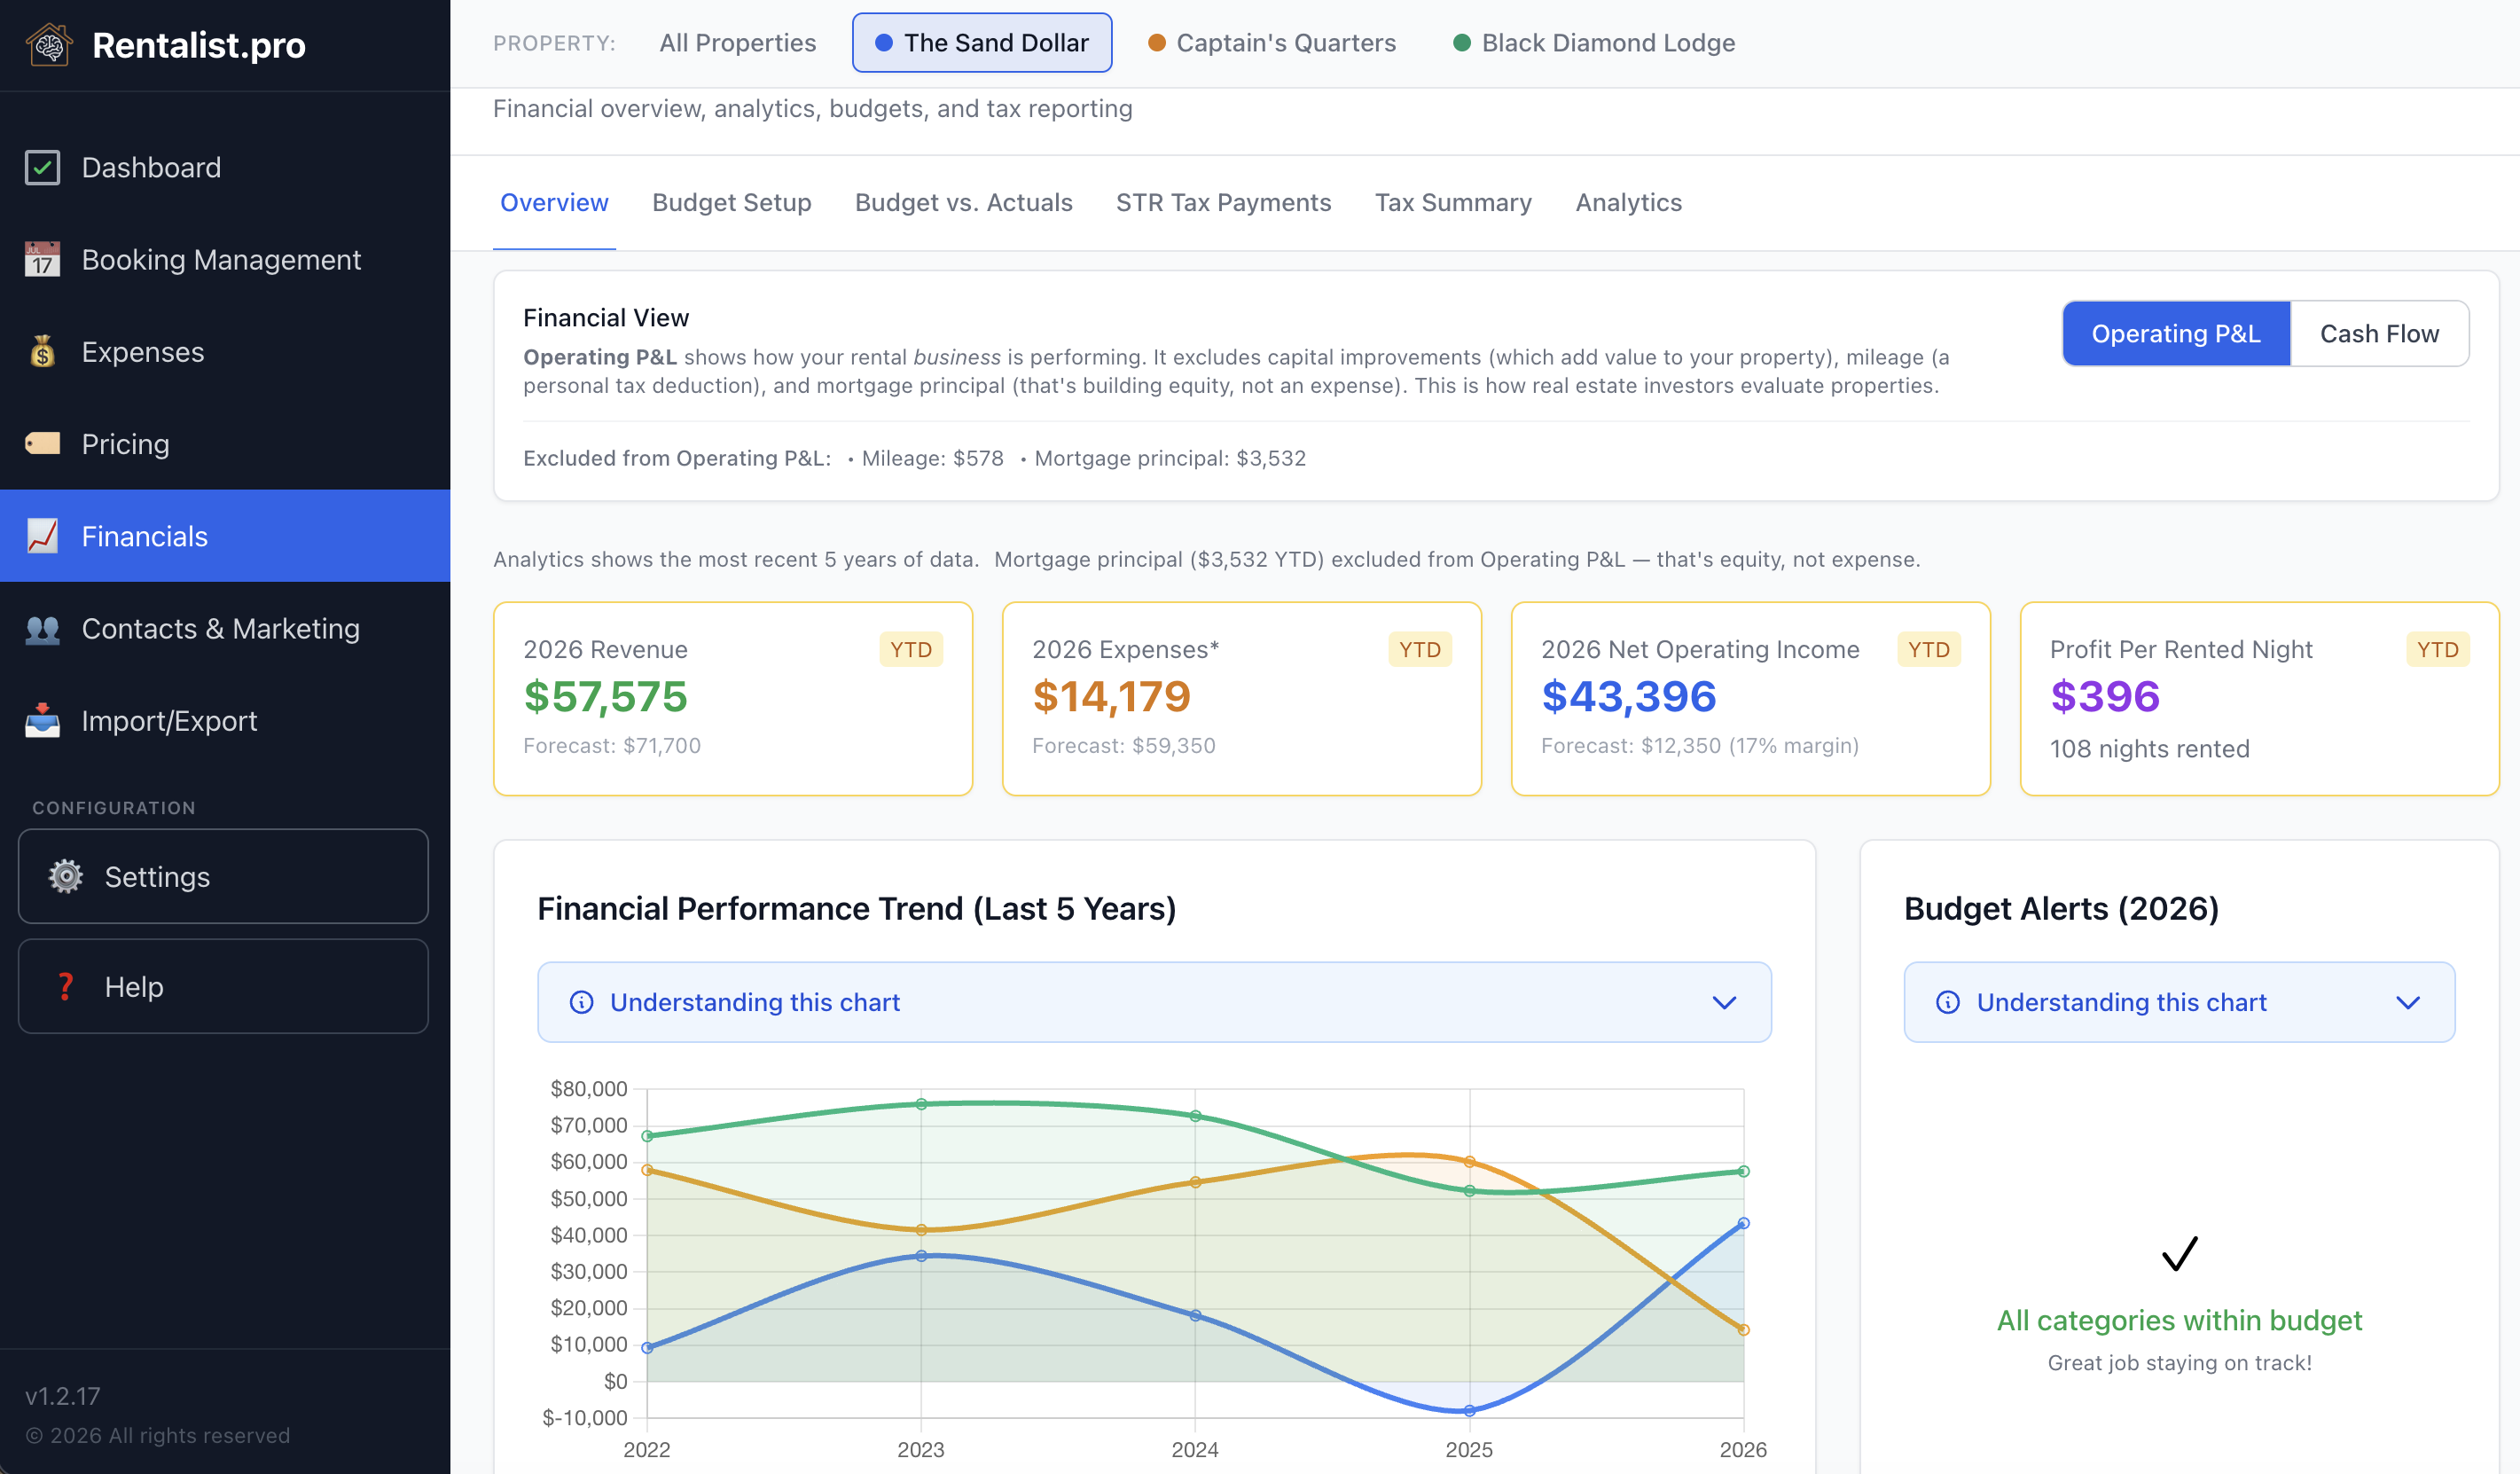
The Overview tab has a toggle that switches between two ways of looking at your finances. It changes the numbers on that tab and on the Profitability tab under Analytics; the Dashboard always shows operating figures. Both views answer a different question about your property.
Operating P&L (Net Operating Income)
This view answers: "How is the rental performing as a business?"
Revenue: Rent plus fees from non-cancelled bookings, less any commission a platform kept from your payout where Rentalist knows it, plus security deposits you kept and damage or incident payments. Does not include occupancy tax (pass-through) or security deposits you give back (refundable).
Expenses include everything EXCEPT: Mortgage principal (building equity, not an expense), Capital improvements (asset purchases depreciated over many years), Auto/travel/mileage (personal tax deduction, not property operating cost).
Why this matters: This is how real estate investors evaluate properties. It shows whether the rental makes money on its own merits, independent of how you financed the purchase and what upgrade decisions you've made.
Cash Flow (Before-Tax Cash Flow)
This view answers: "How much money do I actually have after paying everything?"
Revenue: Same as Operating P&L. Expenses: Includes all expenses — mortgage payments (both principal and interest), capital improvements, mileage, and every other category. Nothing is left out.
Why this matters: This shows your actual cash position — real money in minus real money out. A property can be operationally profitable (positive Operating P&L) but cash-flow negative if the mortgage payment is large.
Both numbers are useful: Operating P&L tells you if the investment is sound, Cash Flow tells you what's actually happening in your bank account.
Mortgage principal in the two views
When you make a mortgage payment, part goes to interest — a real cost of borrowing — and part goes to principal, which pays down your loan and builds your equity. Principal isn't money you've lost. But you still wrote the check. So it depends on what the figure is for: anything labeled cash flow includes principal, because that money left your bank account. Anything measuring profitability — Operating P&L and the deductible totals on your tax report — excludes it. Rentalist splits the payment and reports both halves. It isn't the authority on what you can deduct — verify with your accountant.
Where to change this setting: Go to Budget & Analytics > Overview and use the Operating P&L / Cash Flow toggle. This affects the Overview tab and the Profitability tab under Analytics.